Summer Learning Series: Thinglink Teacher Challenge 2018


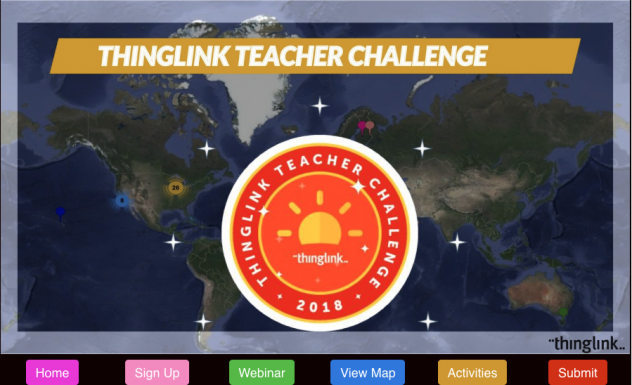
For the past 5 years, Thinglink has facilitated a summer teacher challenge in order to provide teachers an opportunity to learn how to create immersive stories and digital learning adventures using their platform. The challenge consists of 7 activities with built in tutorials to be completed at your own pace. Even though I was an early adopter of Thinglink (and pretty much thought I know everything), I always walked away from these summer challenges with new knowledge and ideas for implementation.

We are currently 2 weeks into the challenge, but it’s not too late to register and catch up. This is a self-paced professional development in which participants progress through the lessons on their own schedule. Click here for more information about the Thinglink Teacher Challenge

I was honored to be asked to share a 360 immersive story during the webinar kickoff. You can view the archived webinar here. You just need to sign in using your email address for the video to play. Here is the image I shared:

The 360 image itself was already in the Thinglink Library, so I just used the handy clone feature so I could create my own immersive story. This 5th grade lesson is made up of a variety of multimedia content from various websites like Scholastic, Discovery Education, and YouTube to explain the process of Immigration through Ellis Island.

I used numbered icons because the order in which the students interact with the tags is important. Each tag builds on the knowledge learned in the previous tag to provide a in depth and immersive experience. My favorite new feature within the interface is the ability to add a label to your tags. I like to use verbs so that when the student hovers over the number, it tells them what they are about to do.

The first tag is just a simple engage activity where students watch a youtube video of a young boy interviewing his grandfather about his family’s immigration history. And of course, the beauty of thinglink is that it allows you to bring the content directly to your students through embedding.

Scattered throughout the 360 image are some sound icons that contain audio from actual immigrants sharing their first hand experiences. I just played the tracks on my computer and used the Thinglink app to record the embedded audio. This adds more authenticity to the story when they can hear their actual voices.

The 2nd numbered tag is the explore section where students interact with the Ellis Island virtual tour from Scholastic. This was the site that inspired the idea for the lesson. I had been using their Thanksgiving virtual tour for years and got really excited when this one came out. Students click through each stop to read, explore photos, view videos, and listen to audio which makes the entire tour feel like they’ve traveled back in time to experience the process.

The 3rd tag is a video from Discovery Education that explains what life was like for the immigrants once they left the Island and started their new life in this country. (Subscription required)

The 4th tag is another component from Scholastic that contains several charts and graphs breaking down the numbers and regions. I like this one because it goes beyond the 19th century into today so they can see that immigration still is happening, although the process is very different.

They next activity is where they apply their newly acquired knowledge to create their own Thinglink app smash using Google Earth on the iPad. This Google Slide contains directions and resources to help them answer the essential questions. The 6th tag is where they share their project on a Padlet wall for peers to view and provide feedback.

The final tag includes directions for a reflection activity where they have to compare and contrast the immigration process from the early 1900s to today.

I used both the web version of Thinglink and the Thinglink app to build the lesson. During the teacher challenge, you will learn how easy it is to navigate the interface and see tons of examples of how Thinglink can support curriculum concepts. 

Summer Learning Series: NEISD Tech Camp

Each week from now until mid August, I’ll post a series of summer learning opportunities for those that are looking to try something new in the Fall. This first week will feature the classes I’m offering at my district’s annual Tech Camp on June 11-12.

It’s no secret that for the past few years I have become obsessed with Google. One app that I have struggled with in the past is spreadsheets. I understood the basic functionality, but didn’t really see how I could use it outside of obvious math connections. Thank goodness for Alice Keeler. After a year of participating in her Go Slow Workshops, I am now able to share a variety of templates, ideas and add-ons. Click here to access resources for A Spreadsheet Can Do That?


The second class I’m offering is a collection of ideas and resources I’ve been curating for while to support the 4Cs. Click here to access Using G Suite to Foster the 4Cs.


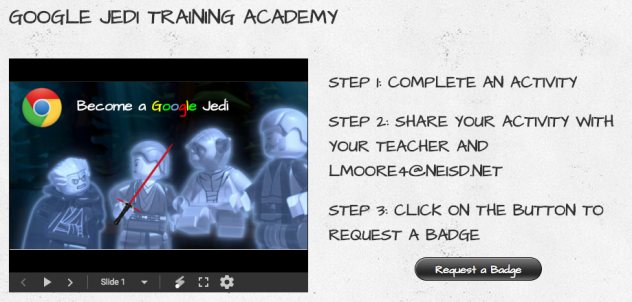
The third class introduces teachers to micro-credentialing for students. Rock the Lab offers students the opportunity to earn cool Star Wars themed badges while learning the basic functionality of Google Docs, Slides, Sheets and Drawings. Click here to access Google Jedi Training Academy.

May the Fourth Be With You

May the Fourth be with you! Friday, May 4th 2018 is Star Wars Day, the fan-created international celebration of all things Jedi. (Fans of the Dark Side will have their turn Saturday with their own day, “Revenge of the Fifth.”) There is an entire page on Rock the Lab dedicated to providing you and your students activities that celebrate the most successful film franchise of all time. But beware, not everyone, especially The Empire, wants you to celebrate this day:


Star Wars Day Attack Ad: Say No to May the 4th on Disney Video

Just have your students head on over to Rock the Lab, scroll down to the bottom of the home page and click on the Star Wars Fun button. There are many activities, some educational and some not so much, that can be used as a brain break from intense Death STAAR review prep. 


A Spreadsheet Can Do That?

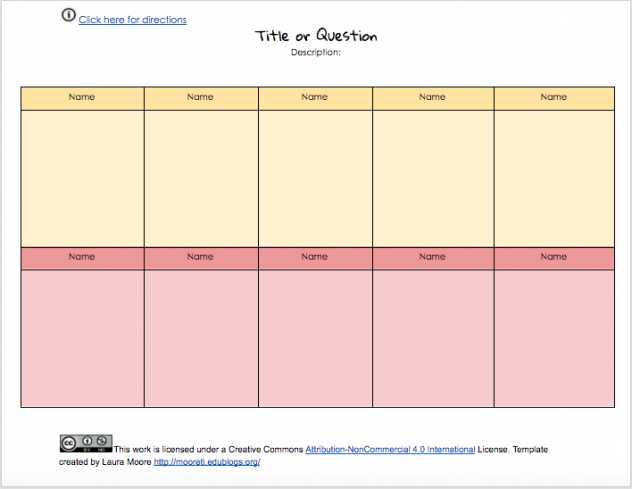
Think a spreadsheet can only be used to analyze data and create charts and graphs? Think again. Explore different ways a spreadsheet can be used for digital discussions, critical thinking adventures, and other ideas you never knew you needed! Below are some of my favorite Google Sheets activities that use the apps unique features in ways that make learning engaging and fun.

Teacher Tools Using Google Add-Ons

Google add-ons let you do more with your Google Docs and Sheets by adding new, useful features such as creating a tab for each student in your class or creating a spreadsheet for collaborative discussions with each topic on its own tab. Most add-ons are created by third-party developers and published to the add-on store.

Conditional Formatting

Cells, rows, or columns can be formatted to change text or background color if they meet certain conditions. For example, if they contain a certain word or a number. Click here for a full video tutorial.

Data Validation

Google Sheets supports a built-in mechanism called data validation rules. Data validation rules allow you to constrain the values that can be entered into a worksheet cell. You can create a dropdown list inside of any cell. Click here for a full video tutorial.

If Functions

A Google Sheets IF function allows you to use decision making in a worksheet. The If function tests to see if a certain condition in a cell is true or false. You then use cell referencing to pull data from one sheet to the next. Read more about them here and here.

Interactive Educational Games

Easily turn a Google Spreadsheet into fun activities such as flash cards, quiz shows, bingo, word search games and so much more. Click here for a full video tutorial.

Charts and Graphs

When creating a spreadsheet, you frequently find yourself wanting to analyze your data. you can even display your data in the form of a chart or graph.

Sheets Tips and How-Tos

Login to Launchpad to view the following Hoonuit Tutorials, (NEISD Teachers Only)

Nooooo, Not Padlet!

Yesterday, Padlet announced what every educator fears the most…limitations on the free version of their product. Now, users can only make up to 3 Padlet walls for free. I totally get it. Padlet is a company made up of employees with families to support. The freemium business model is not new to the world of educational technology and almost all of the popular services teachers use have limitations. So, why is this announcement so painful? Because online tools such as Padlet, Thinglink, Sutori, Flipgrid and other similar cross-curricular platforms are guiding teachers AWAY from worksheets and TOWARDS implementation of the 4Cs (creativity, collaboration, critical thinking, and communication). Right now, teachers that want to utilize these amazing products end up paying for it out of their own pocket. Let’s not forget they are also paying for paper, glue, poster board, markers, crayons, paper plates, plastic wrap, toothpicks, and everything else that Hobby Lobby carries. What’s going to happen when they have no more money to spend on their students because, at some point, they must use their paychecks to put food on their own table? I can tell you…they will go back to worksheets.

Obviously, district and state entities aren’t doing enough because this has been a systemic problem for YEARS. So, what are some things we can do to continue in the direction of educational best practices without going broke?

  1. Ask campus admin or PTA for funds to purchase campus-wide subscriptions
  2. Stop purchasing devices and start purchasing platforms that are cross-curricular in nature and support the use of the 4cs. If a campus spends $700 on a single iPad, it will be obsolete in about 4 years. Apple won’t allow the device to update to the latest operating system, therefore making the apps buggy and eventually useless.
  3. Stop buying worksheets on TPT (Teachers Pay Teachers). I guarantee teachers spend more money on that site than they would on a monthly subscription to a quality platform.
  4. Sometimes platforms offer an educator’s network where you can get your subscription for free if you promote their product and participate in blogs and webinars. 
  5. Try to mimic what a service does using free tools like Google. Here is a mock “Virtual Board Doc” that simulates some of Padlet’s features. It is by no means fancy pancy, but guess what? IT’S FREE! Go to file>make a copy and modify as needed.

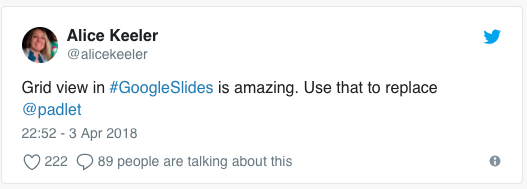
       6. Alice Keeler recently posted this Tweet. Genius, of course. Make a copy of this template.

Demystifying HyperDocs

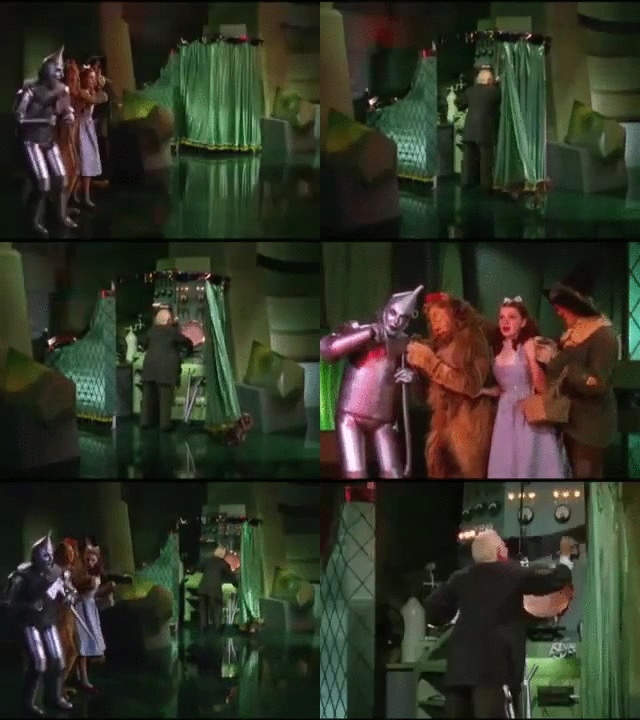
Before it was revealed that Oz was just an ordinary man, Dorothy believed him to be magical or God-like. Once the curtain was pulled back, she realized he wasn’t performing magic at all. The bells and whistles he used just made it seem like magic.

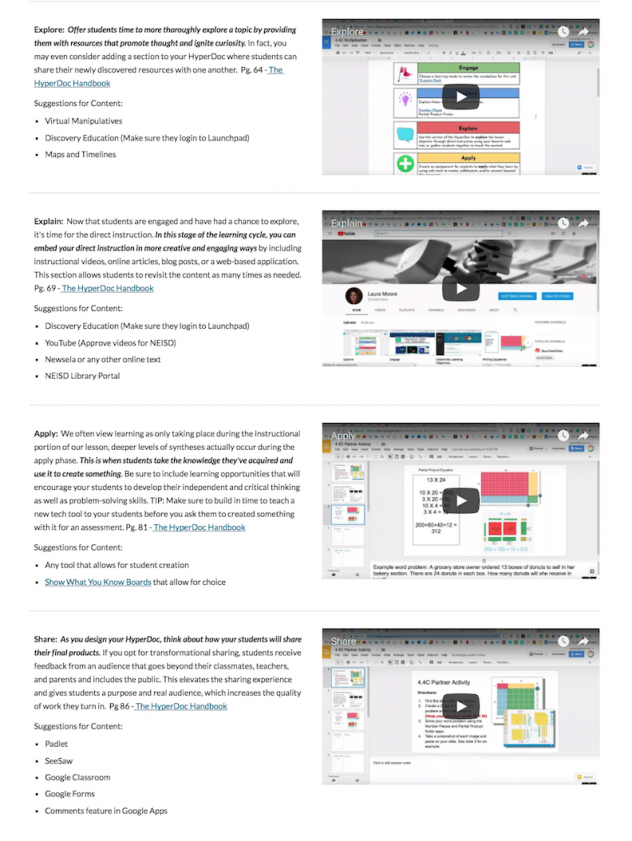
Most teachers find and use HyperDocs that other educators share on the Internet. Some understand the creation process and are able to make their own interactive lesson from scratch. Others may not be well versed in G Suite or just have no idea where to find the multimedia and interactive content to include in the learning cycle. If you fall into this category, HyperDocs could seem somewhat magical. 

I’m attempting to demystify HyperDocs during a 3 week online course offered to teachers in my district. I decided to create a series of screencasts to capture my thought process and the actual creation of the HyperDoc. 

I also recently participated in an @EdTechBites Podcast with Gabriel Carrillo where we discussed HyperDocs and how they differ from traditional ways of delivering digital content. Hopefully, these 2 new resources will help you on your journey to implementation.

#NEISDTweechers

Join @Edtechbites and I as we introduce Twitter to teachers in our district through a 2-week online course. We would love for those that have been using this platform for professional development, integration ideas, and sharing the great things that students are doing in the classroom to engage in our discussions and participate in our Twitter Chat on Wednesday, Feb. 28th from 7:00-7:30 pm CST. Hearing from other educators that have embraced social media would really be beneficial to their implementation. Don’t forget to use the #NEISDTweechers.

Posted in Uncategorized

Share SeeSaw Activities with Other Teachers

Twitter is one of my favorite places to get inspiration for lessons. Sue Kuentz recently Tweeted an idea that I thought would make a perfect SeeSaw activity. In her blog post, she explained how she incorporates fun interactive writing workshops into her storytelling days at the elementary level. This particular idea explodes a moment in Goldilocks and the Three Bears. Sue isolates the moment when Goldilocks tastes the Bear’s porridge and asks students to provide more detail about how and why the bowls are either too hot or too cold.

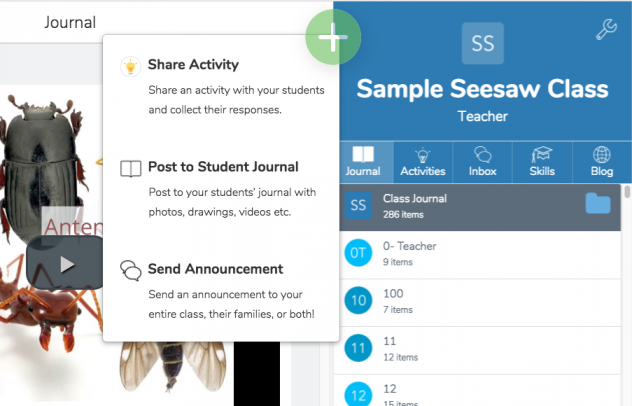
Making this activity digital is easy. In your class, click on the green plus sign and choose Share Activity. Then click on Create New.

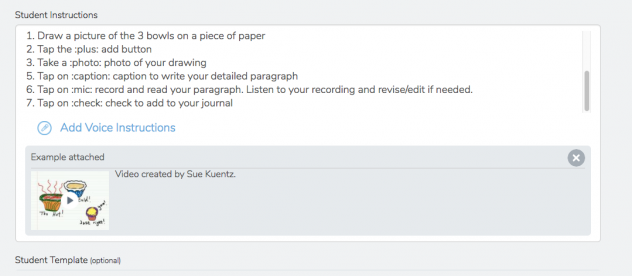
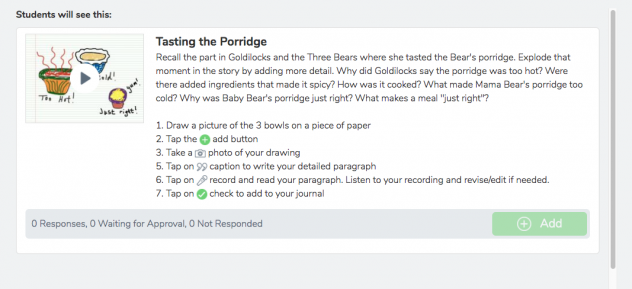
Fill in details of the activity: activity name, student instructions (can include examples and voice instructions), an optional student template, and the student(s) tagged to the activity. Use these text shortcuts to place SeeSaw icons in your instructions. Once you tap the preview button, the icons will appear.

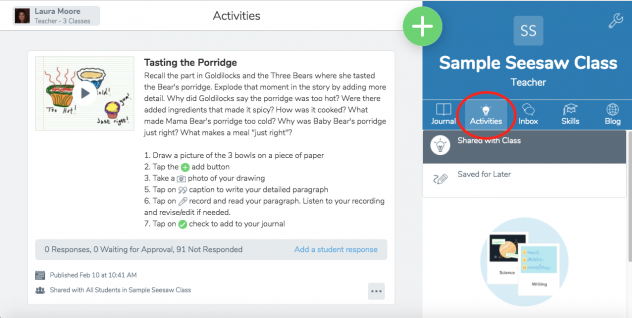
Then click on Share. Students can find the activity in the Activity Tab.

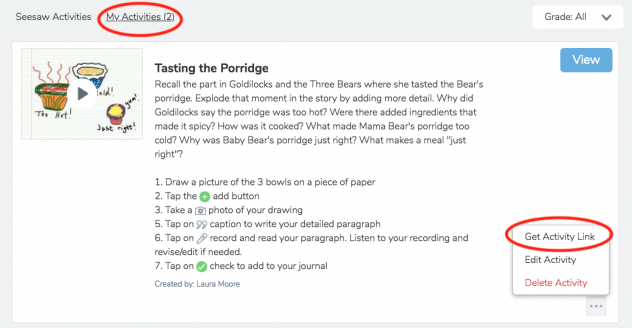
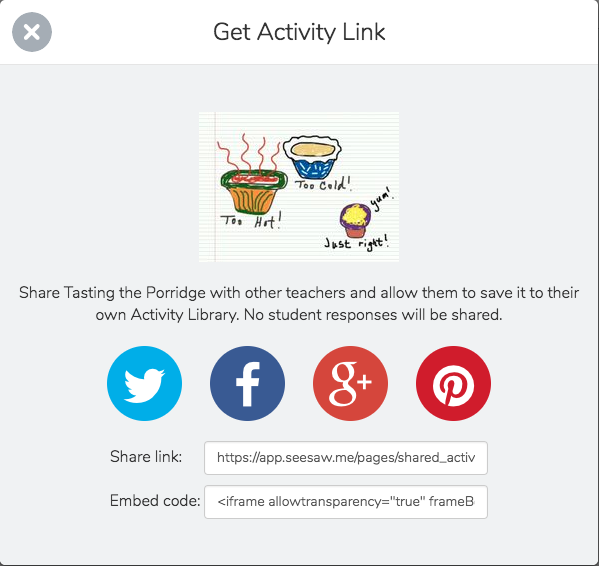
To share a link to your activity with other teachers, click on the My Activities tab in your library and then click on the 3 dots. Choose Get Activity Link

Here is a link to this activity inspired by Sue.

Parallax Digital Storytelling

Website design has really evolved over the past few years to include interactive experiences that provide depth and movement. Parallax scrolling is a technique that involves objects and layers within a webpage moving in different directions or at different speeds. The result can be mind-blowing. The first site I visited a couple of years ago was NASA Prospect, an interactive story of the planet prospectors, left behind by NASA to recover the golden objects of humankind scattered across the solar system by a global disaster. It propelled me to begin a quest for similar digital stories that could be used with students. 

Every Last Drop is a visually stunning public service announcement to inform people living in the UK how much water they actually use in a day and ways in which they can conserve water usage. You will find yourself scrolling up, then down, then up, then down again to see how all the graphics work together to tell this story.

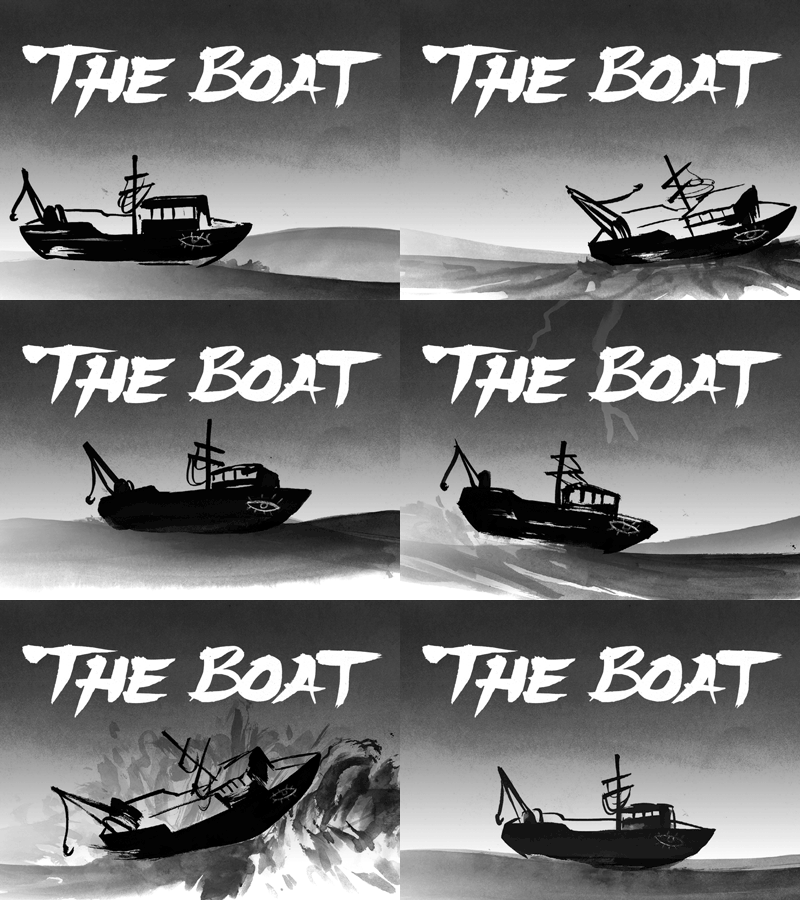
The Boat is a Vietnamese graphic novel that includes text, sound effects, and images that sway back and forth to make you feel as if you are really traveling on a refugee boat across the ocean. This story is particularly relevant to today’s current events as it provides empathy and insight into families seeking refuge in other countries. Turn up the volume for this one.  

The Fallen of WWII is a data-driven interactive documentary that examines the human cost of the Second World War and the decline in battle deaths in the years since the war. The 15-minute data visualization uses cinematic storytelling techniques to provide viewers with a fresh and dramatic perspective of a pivotal moment in history. The film follows a linear narration, but it allows viewers to pause during key moments to interact with the charts and dig deeper into the numbers.

After 6/4 is an incredible study of The Tiananmen Square protests of 1989. The event is told from 2 different perspectives, those that believed it was a massacre and those that perceived it to be a riot. It includes actual resources and interviews with participants in the movement.

Hobo Lobo of Hamelin is a short infinite-canvas parallax webcomic about a wolf and a town, his woodwind, and their rat problem.  

Journey to the Center of the Earth explores how far you would have to travel to reach the Earth’s core, and what you would see along the way.

After the Storm is a message to future disaster survivors. It chronicles one family that survived a devastating tornado that touched down in Alabama in 2011.

Draw a Stickman absolutely blows my mind. It may not be a great example of parallax scrolling, but it takes interactive storytelling to a whole new level. You draw the main character and props that are key to the story and the website takes care of the rest.

The Walking Dead (ok, not so much for elementary) is perfect for the zombie apocalypse obsessed fan who wants to take a gander at the inner workings of the show. The entire experience is told in the form a graphic novel. The direction of the moving screen scrolls horizontally as you learn what it’s like to be a zombie extra for a day.

Weltrade isn’t exactly educational in nature. In fact, it’s a commercial for traders looking for opportunities to increase their capital. Learn how to pose with confidence, dare I say arrogance, while listening to some smooth jazz. Have fun with this one.


Posted in Uncategorized

Level Up with an If FUNction HyperDoc

About a month ago I published a post about using If Functions in Google Sheets to facilitate student learning adventures. Since then, I’ve been playing around with combining if functions and a HyperDoc learning cycleI thought about the way the workspace within a sheet was laid out (cells made up of rows and columns) and decided multiplication would work best. During the creation process, several more unique features naturally fit the task I had in mind.

Data Validation – This handy feature allows you to create a dropdown list inside of a cell. Students have to answer multiple choice questions in the Evaluate tab.

Sharing a Spreadsheet with another student allows for collaboration and peer feedback. Students answer a word problem created by their peers on the Share tab.

Fill tool to change the color of the cell is perfect for creating arrays or skip counting on a number line. Color coding direction and answer boxes allowed for some consistency. Blue boxes contain directions while white boxes identify where the students type in their answers.

Assigning a script to an image is the feature I used on the Apply tab. When students click on the dice, a random number is generated to replicate the roll.

The lesson may not be intuitive to you or your students so I created a walkthrough video. Click here to make a copy of the If Function HyperDoc. Let me know how it goes in the comments section.

18 Lessons to Try in 2018

My personal explorations in 2017 involved anything and everything Google. Alice Keeler redefined Google Classroom for me through her Go Slow Workshops, and George Couros inspired me to be innovative via his book, The Innovator’s Mindset. Reflecting back on all of the great stuff I learned prompted me to created an interactive Thinglink image that contains a few lessons you might want to try with your students in the new year. Hover over each icon to access a link where you can make your own copy. 

Happy New Year!

Posted in Uncategorized

Tour the Earth with Voyager

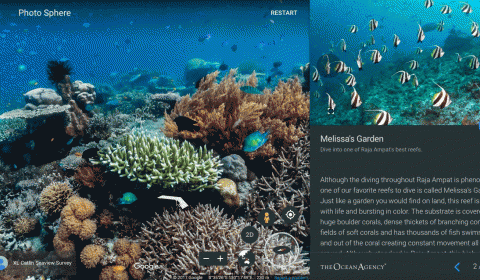
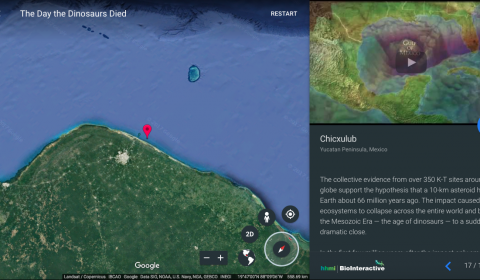
Google Earth Voyager is a great way to get lost and quickly lose about 3-4 hours of your day if you’re not careful. Their partners, including National Geographic, PBS, and The Ocean Agency, have created a collection of map-based stories that’s updated weekly. Topics include travel, culture, nature, history and education. Students can enter a 360 photo sphere of the coral triangle located in Raja Ampat to view an incredibly rich center of biodiversity, or travel back in time to explore the evidence from around the world that finally explained the disappearance of dinosaurs.

There are many expeditions to choose from and many are relevant to elementary curriculum. I’ve gathered some of these together on an interactive Thinglink image. Hover over each pin icon to open a Voyager adventure. 

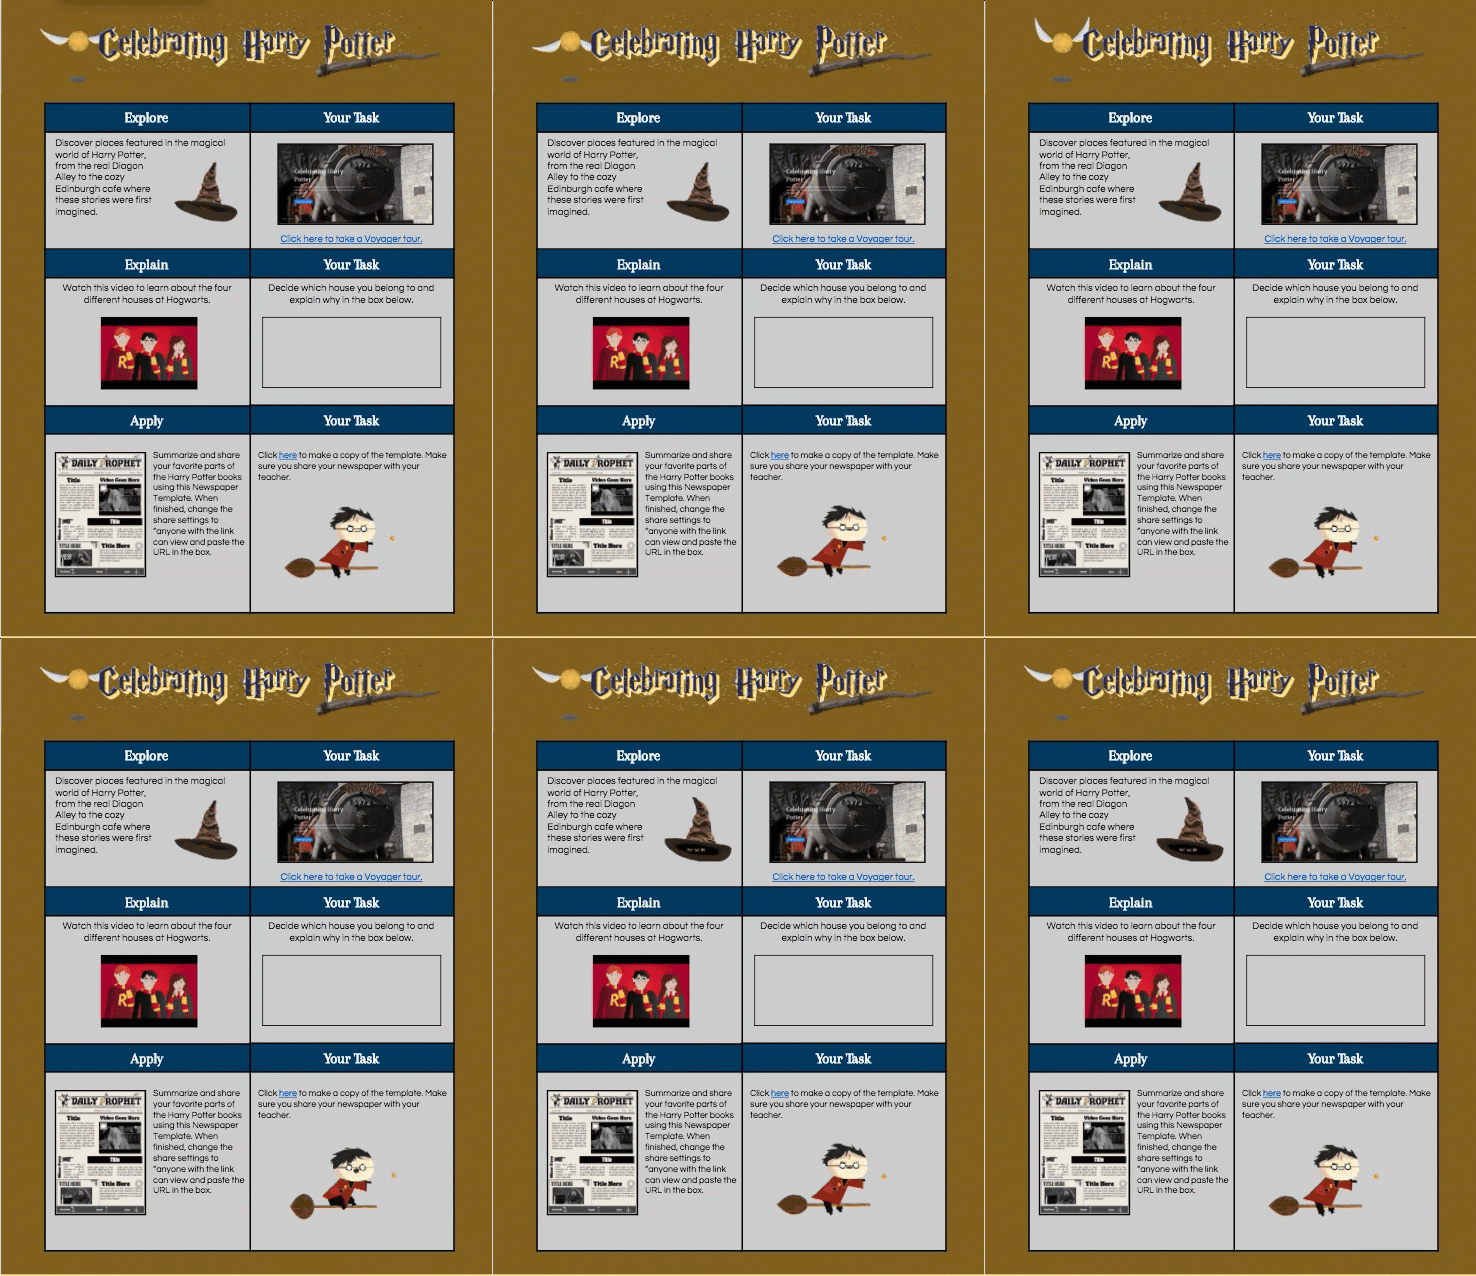
My favorite one has to be Celebrating Harry Potter. Below is an Explore, Explain, Apply HyperDoc that includes this voyage in the explain section. Click here to make a copy.

Digital Advent Calendars

Have y’all noticed the really cool digital advent calendars on Twitter lately? This is a great idea to use with students or even with your faculty. Each day is a challenge to learn something new that you can implement in the new year. Here are a few that I have found. Cheers!

Ryan O’Donnell’s (@creativeedtech) Holiday Advent Calendar. Posting began Dec. 1st. Check back daily for new ideas and resources. 

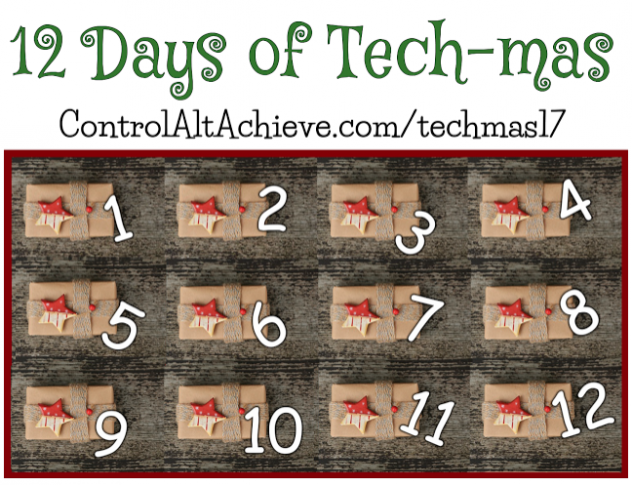
Eric Curts (@ericcurts) 12 Days of Tech-mas. Eric will publish one blog post daily for 12 days. Each blog post will provide a list of useful resources corresponding to the number of that entry, from 1 through 12. Grow your PLN with Eric’s suggestions.

Mariana Garcia-Serrato (@MarianaGSerrato) Hour of Code Advent Calendar  Mariana created a Thinglink interactive image for students to explore a different coding activity every day (top). The one under it is for teachers to explore possible tech tools to use with students.


Shelly Terrell (@ShellTerrell) Digital Click and Learn December Calendar.  Students can count the days till the break or count the days towards class starting again in 2018. Shelly also provides resources on how to make your own Click and Learn Calendar.

Posted in Uncategorized

Hour of Code 2017

The 2017 Hour of Code begins next Monday, December 4th and continues throughout the week. I’ve updated the HOC page on Rock the Lab to include the most recent courses and activities from which students can choose. I’ve also made a quick video to help you navigate the page and point students to the most appropriate activities for their experience level. Remember, Hour of Code doesn’t have to be just one week out of the year. Have students revisit this page often to help them become digitally literate.